Explore the analysis and data visualization.
Use data visualizations to make more effective business decisions.
Data easily available
Everything you need is up-to-date and visualized with dashboards. Whether you run advertising campaigns, wholesalers or manage a team.
Better business decisions
With Business Intelligence solutions, you have insight into even the most advanced correlations between data. This makes you make more accurate business decisions.
Complete automation
Everything happens by itself. No more pasting data, complicated Excel, or lack of up-to-date information.
See how it works— dashboards live.
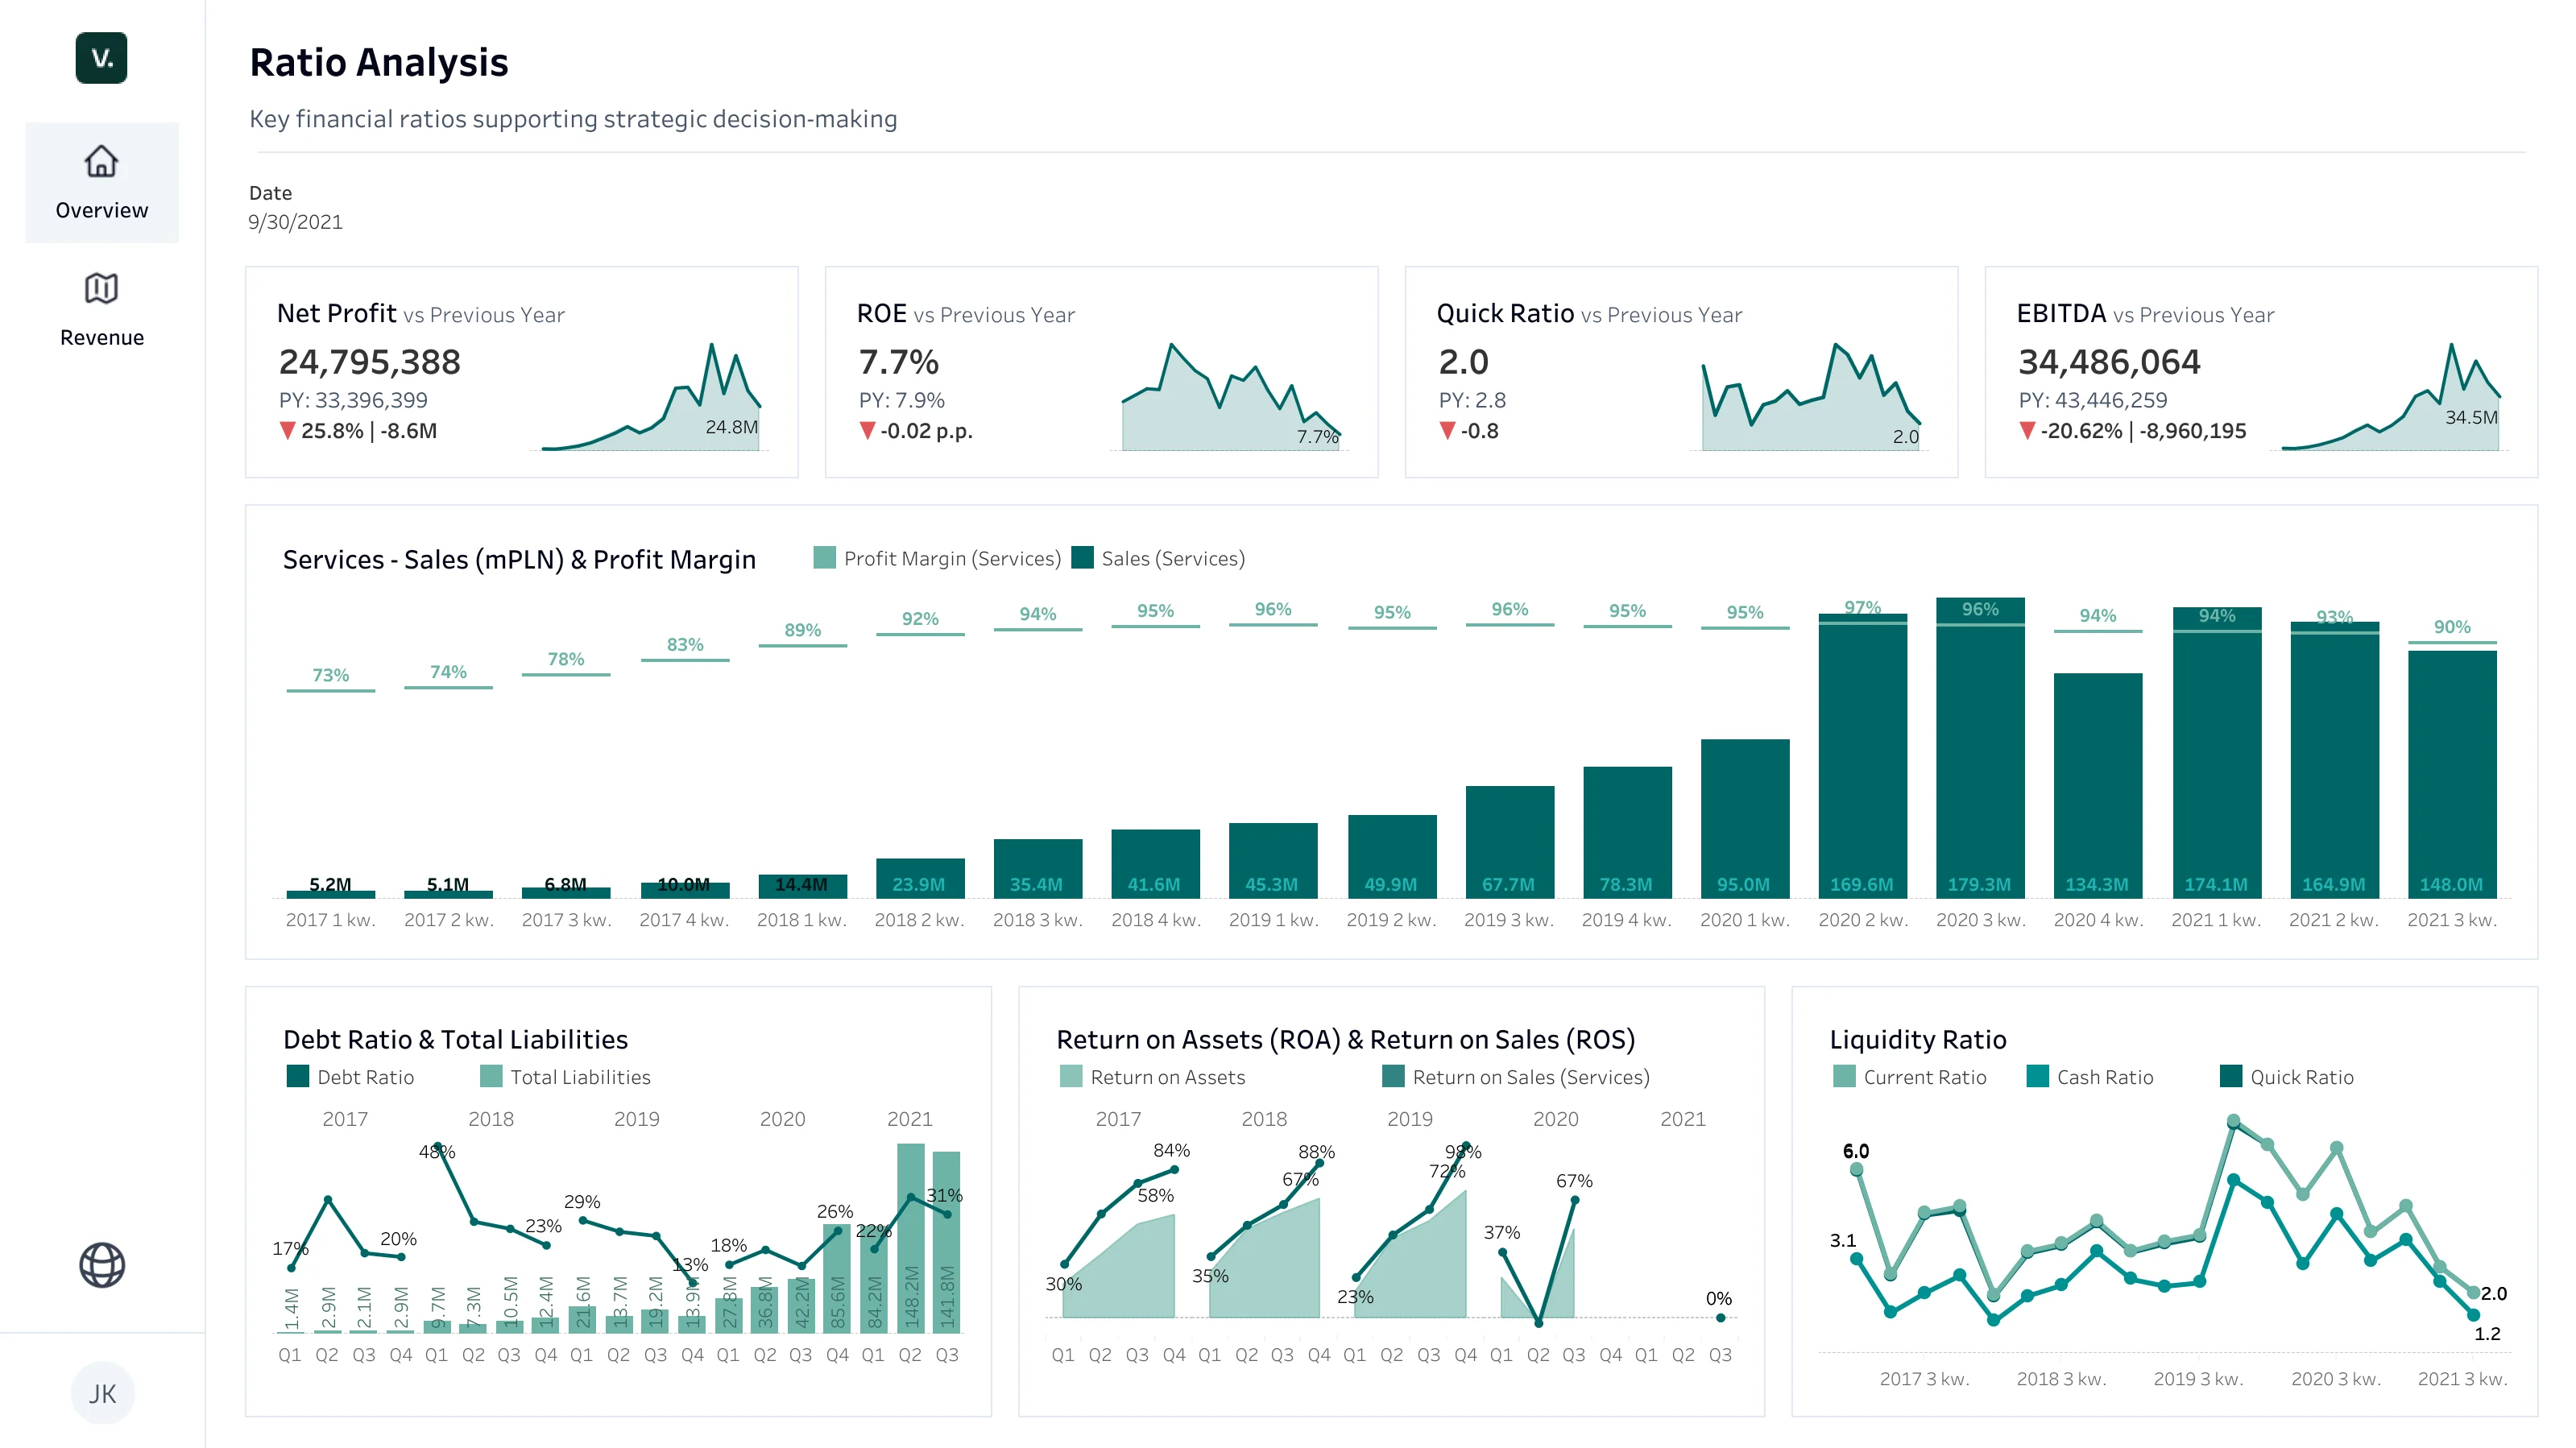
Financial Dashboard
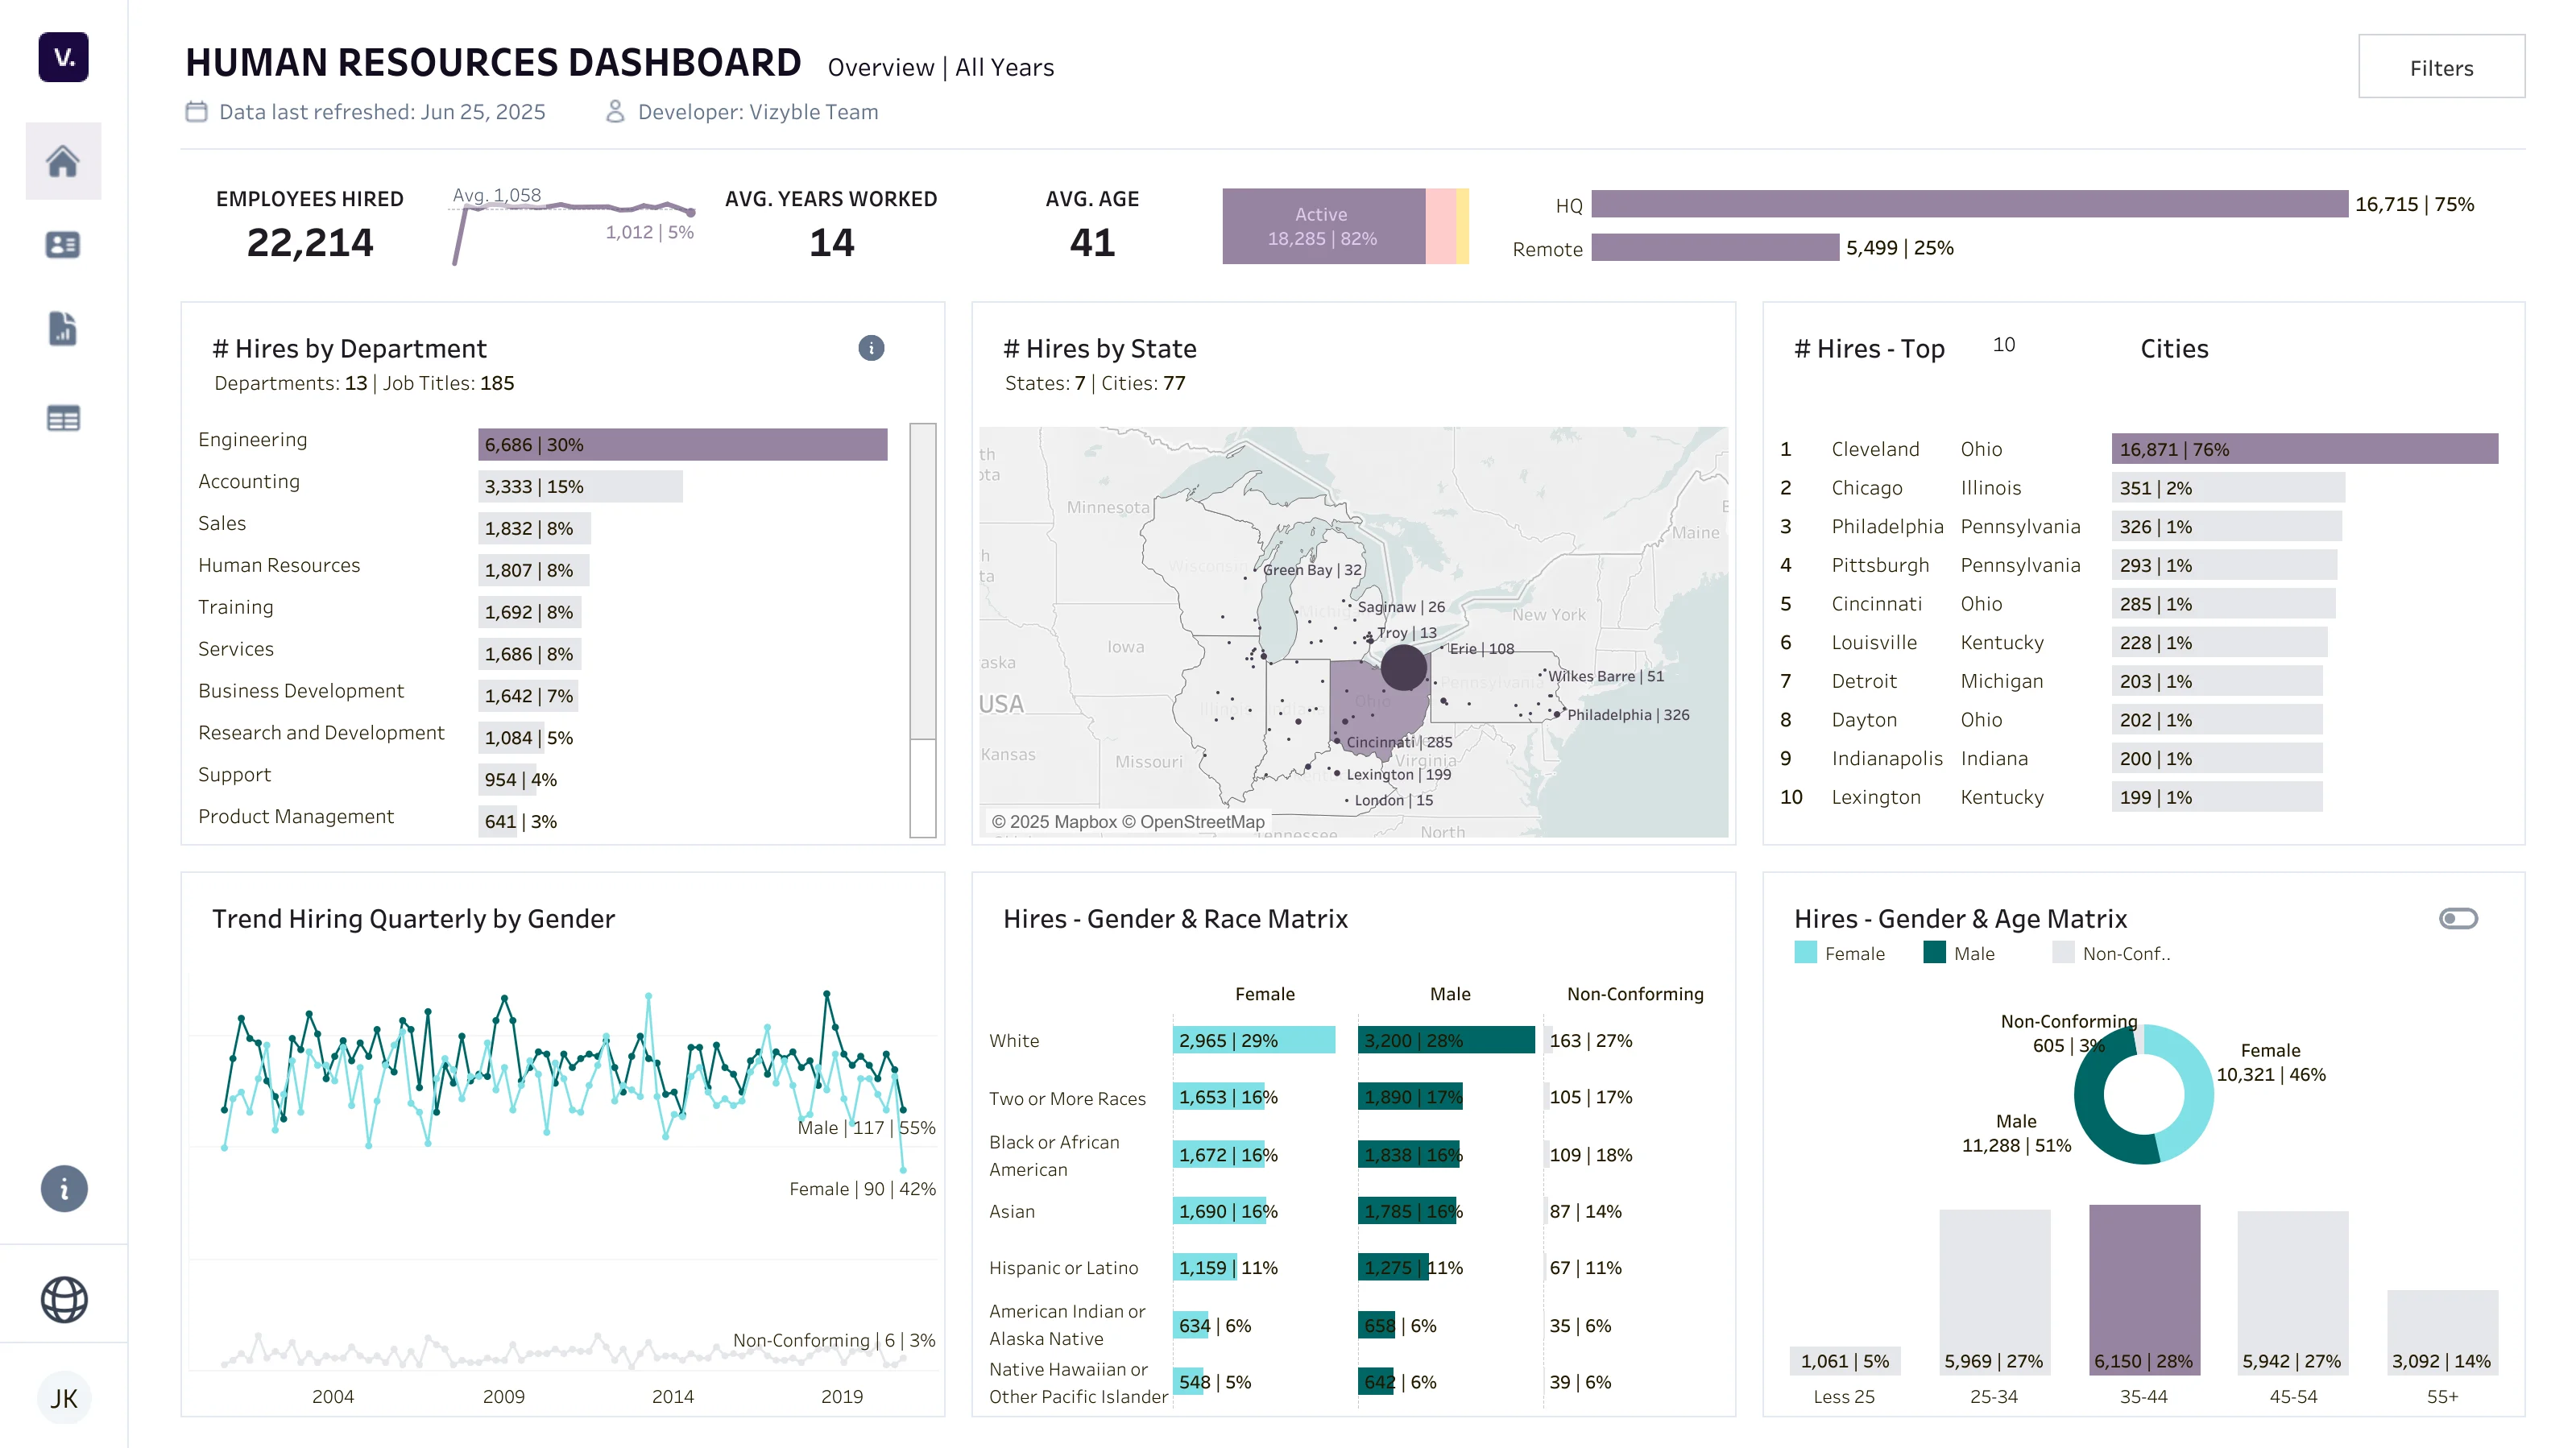
Dashboard for HR
Dashboard for Manufacturing Company

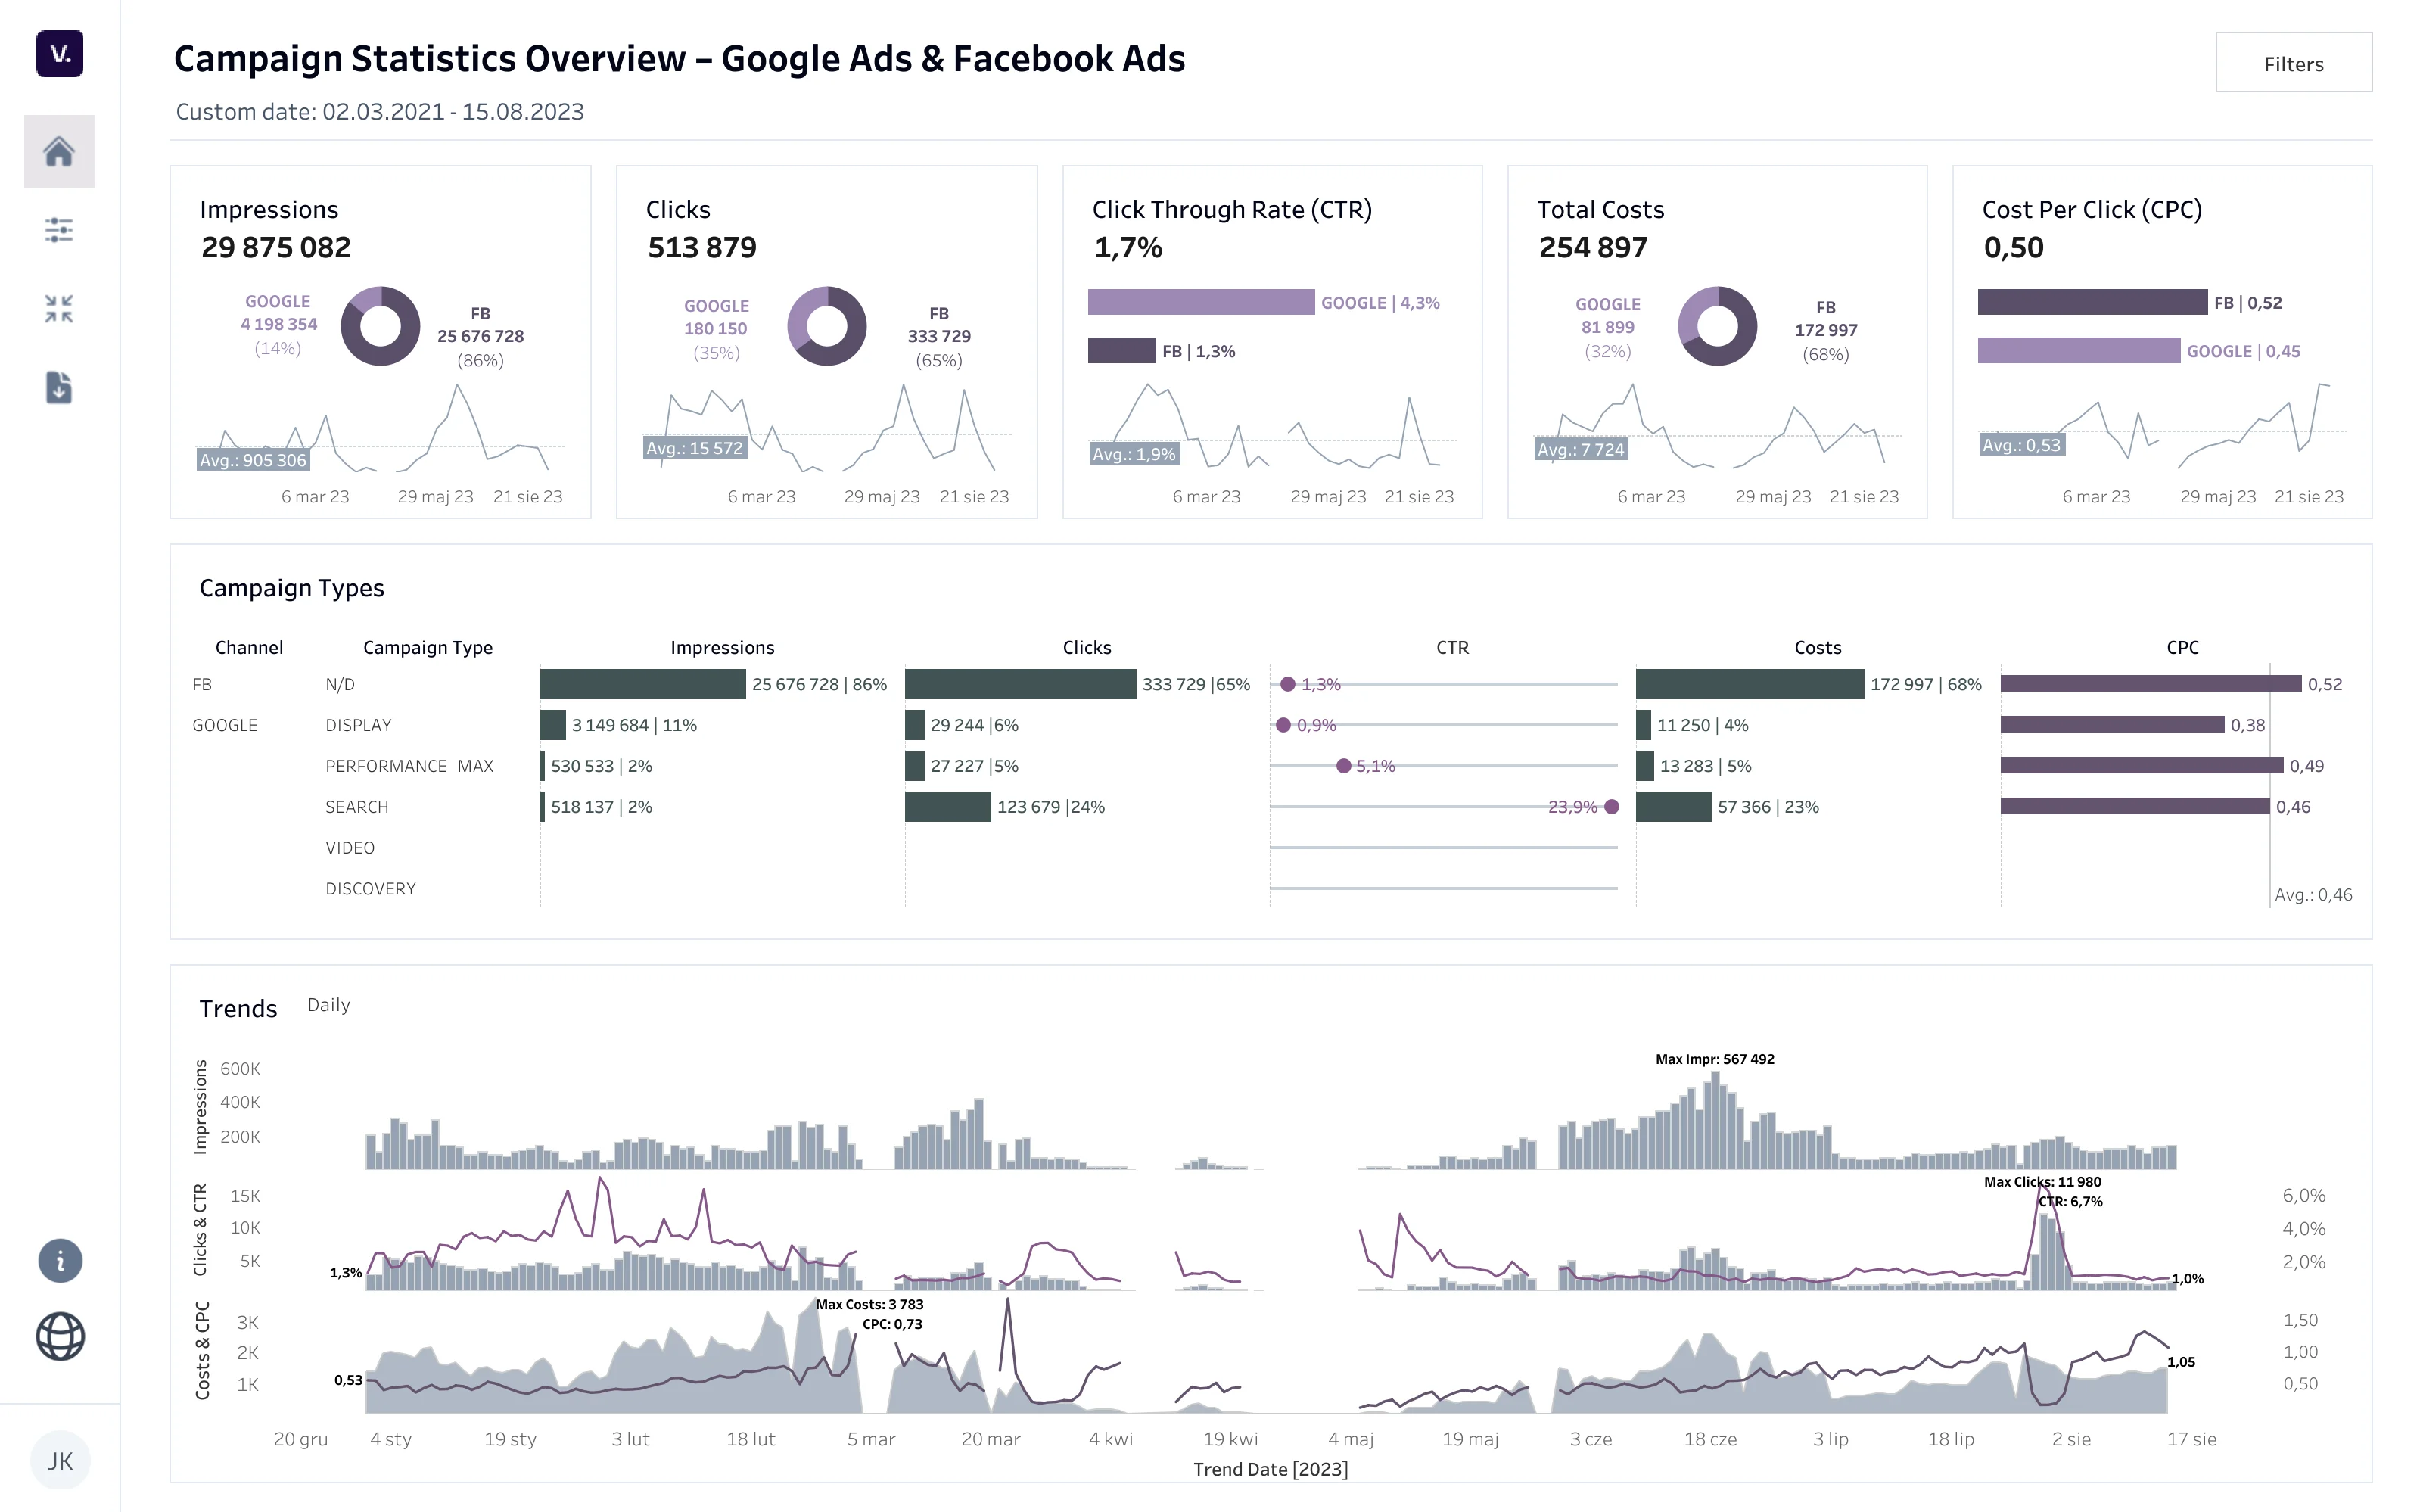
Marketing Dashboard
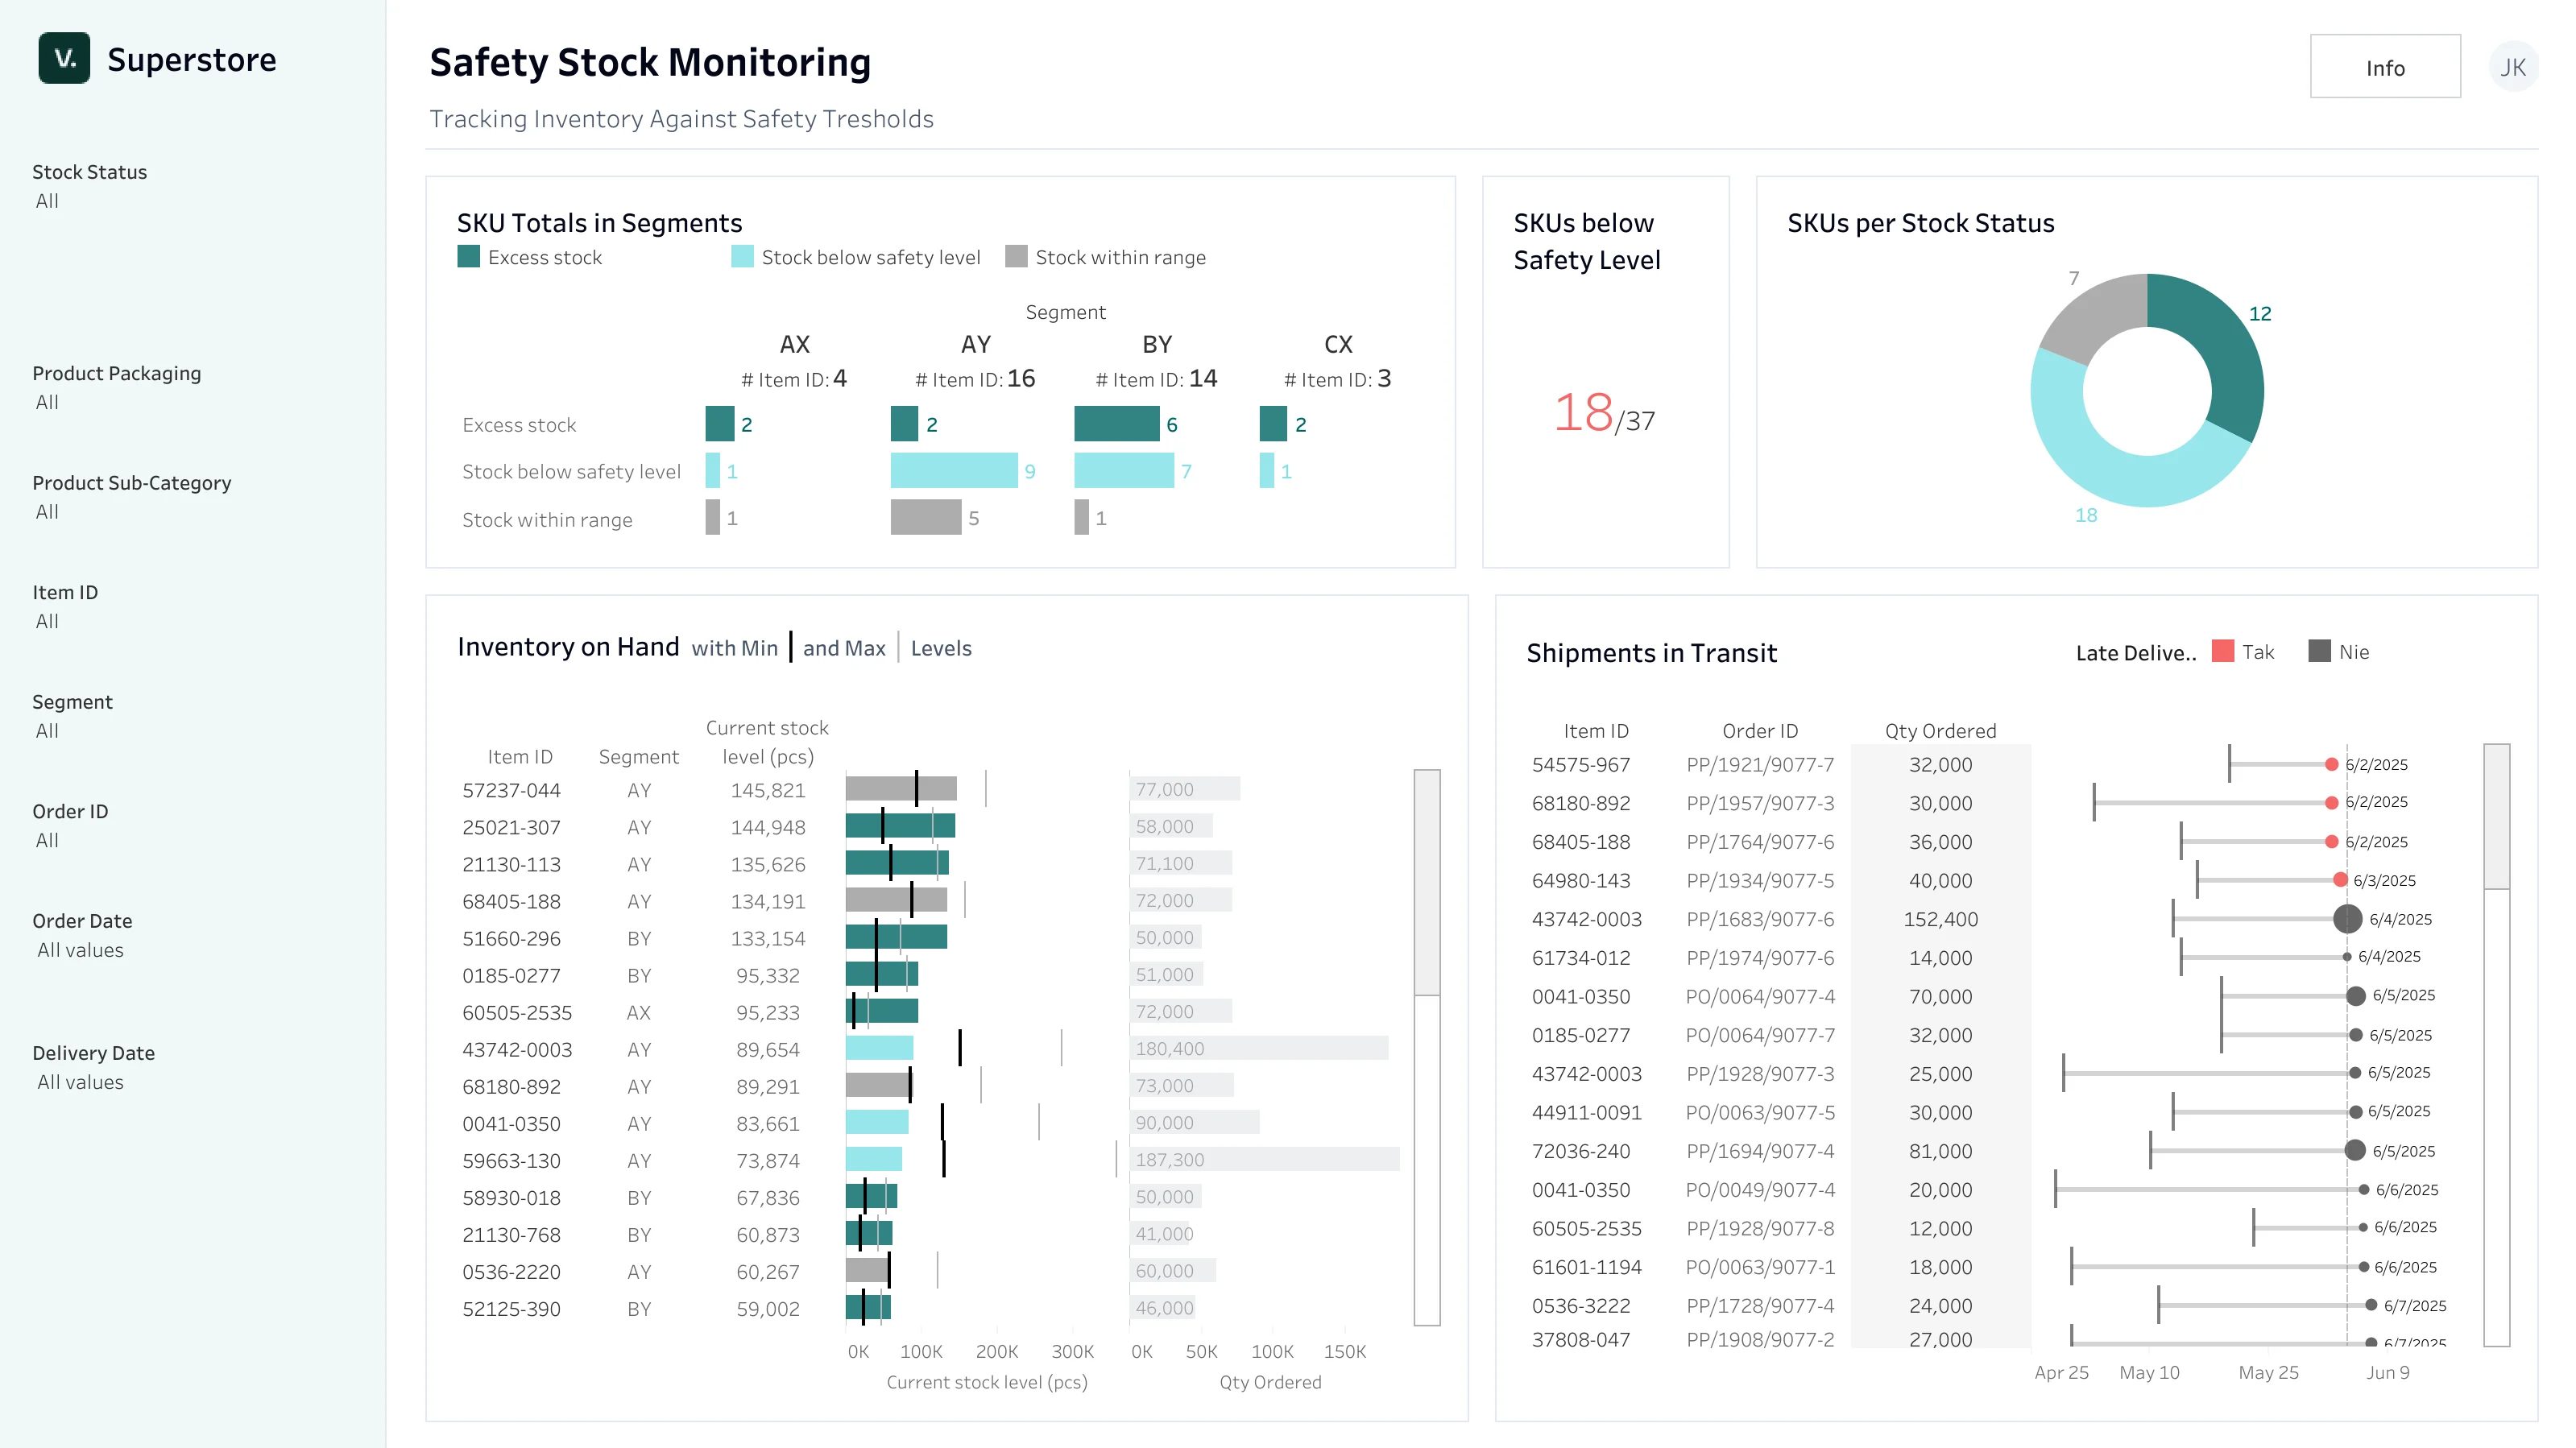
Logistics Dashboard
Dashboard for production

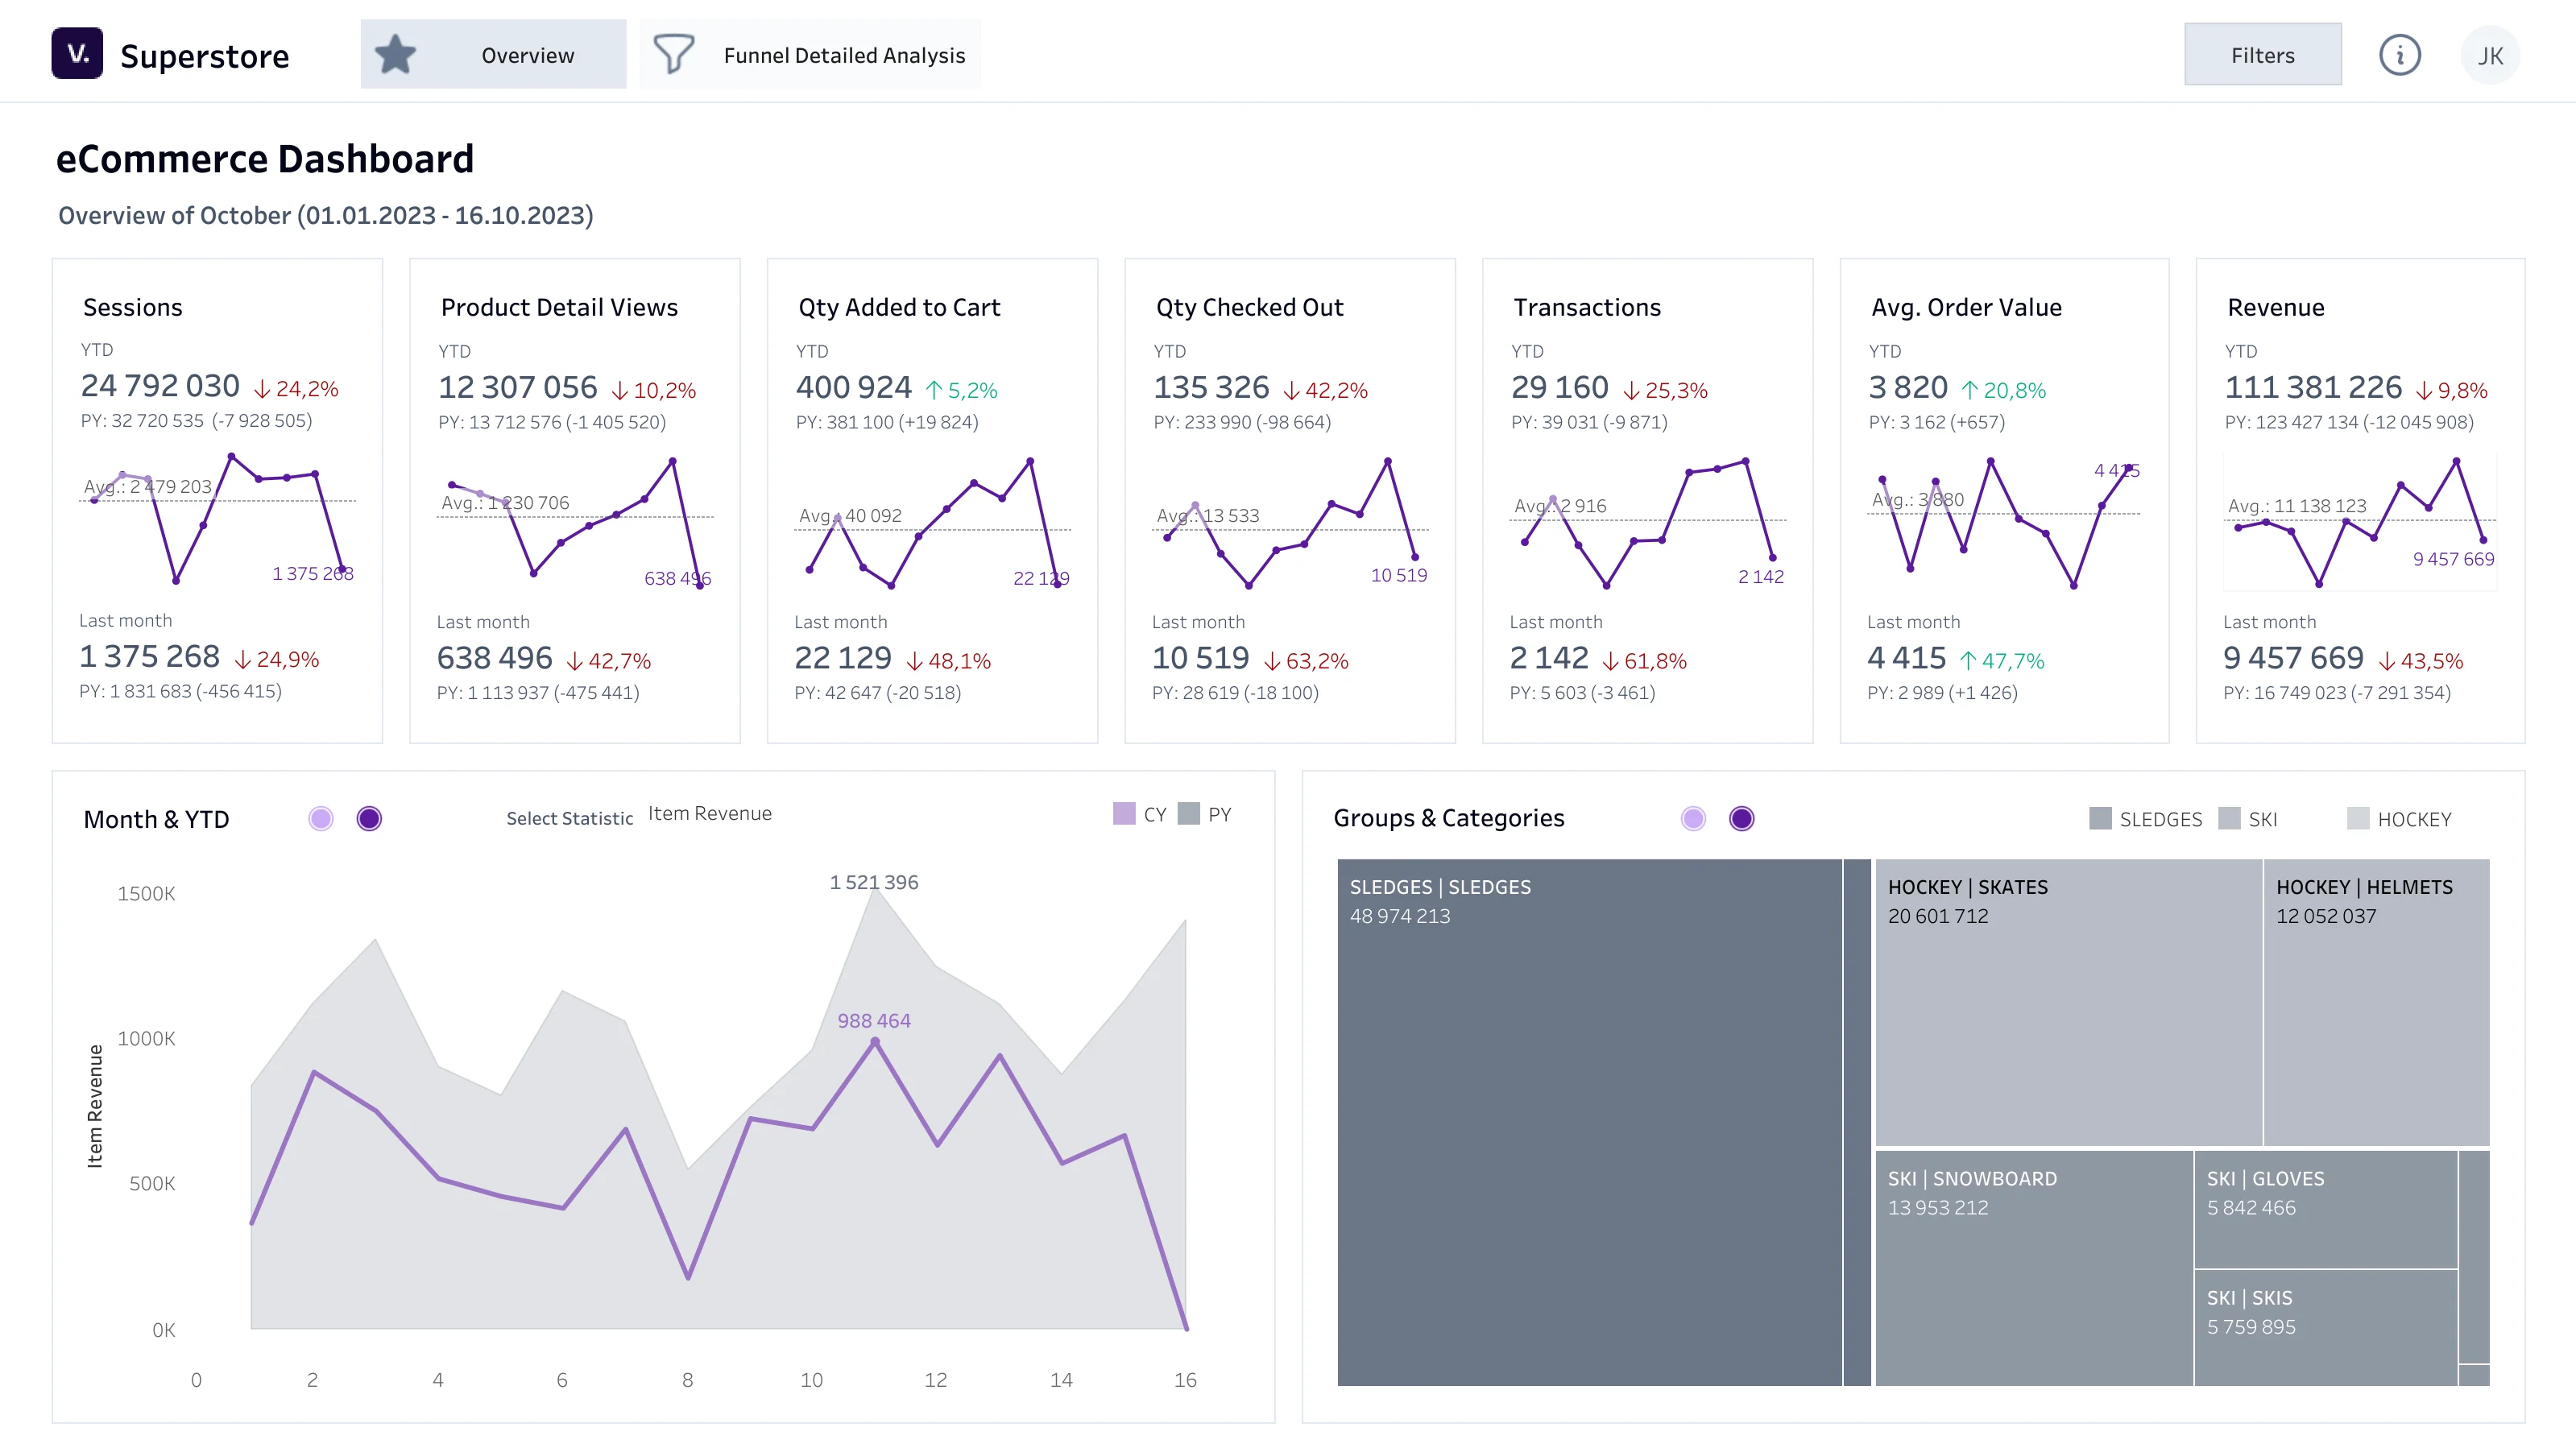
Dashboard for e-commerce
Scope of service
Strategy
Together with the client, we agree on a strategy for the implementation of Business intelligence tools, matching the direction of development of his organization.
Deployment
During the implementation of BI, we install, configure, test, train and prepare documentation. We help at every stage.
Tools
After setting the objectives and expected results, we help in the selection of the tools required for implementation, guided by the chosen strategy.
Maintenance
After the implementation, we transfer all know-how to the customer's resources. All this so that the service in the future can be carried out without additional assistance. Vizyble specialists will be happy to answer any questions and support you in maintaining the process.

Service implementation process
Gathering business requirements
We will start with a conversation — we will define the problem together, and then we will help translate it into specific questions to be answered by the report. We want to understand your needs well.
Analysis of data sources
We will check the available sources — whether they are complete, consistent and usable to the extent required. We can also help you organize your data so you can work on it.
Presentation of the concept
We will propose the concept of the report — layout, data, logic, interactions. All in accordance with best practices.
Creating a report in several steps
We will build the dashboard step by step — you comment, we improve. We usually need 2-3 rounds of iterations to arrive at the final version that will meet your expectations.
Dokumentacja użytkowa
Na końcu pokażemy Ci, jak korzystać z dashboardu. Dowiesz się w jaki sposób z nim pracować i jak wyciągać wnioski.
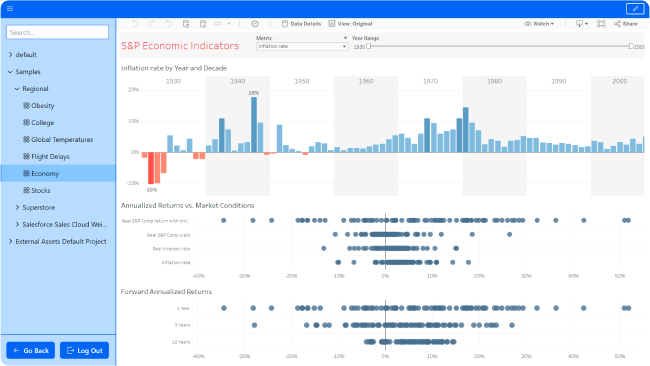
Toolsfor data visualization and analysis.
In the Business Intelligence market, there is a wide variety of tools for data visualization and analysis. At Vizyble, we mostly work in Tableau, which gives you unique data mining capabilities.

Blog. Learn more aboutVisualization and data analysis.
FAQ.
Find the answer to your question.
Business Intelligence solutions allow companies to efficiently collect, analyze and present data to make faster fact-based decisions, identify trends, optimize processes and increase business efficiency. Implementing Business Intelligence solutions can bring a number of benefits to a company, such as faster data-driven decision-making, improved operational and strategic efficiency, identification of trends and patterns hidden in data, increased competitiveness through better understanding of the business, optimization of business processes or increased profitability through better use of data.
We tailor services to specific business problems. We mainly work for manufacturing, retail, service, e-commerce, start-ups and marketing agencies. Do you run a business in another industry? Write to us!
We perform a variety of data analysis, including trend analysis, forecasting, customer segmentation, cost and profit analysis, and much more depending on the client's needs.
We design a variety of data visualizations such as bar charts, pie charts, line charts, heat maps, dynamic tables and interactive dashboards tailored to the client's business needs. The charts are interactive and allow drill-down.
We ensure the security and confidentiality of data through the use of encryption protocols, authentication systems, access privilege management. We connect to the client's infrastructure through VPN.