Financial Dashboard
In the Business Intelligence market, there is a wide variety of data visualization tools. At Vizyble, we mostly work in Tableau, which gives you unique opportunities to explore information. If you want to see the data of your company on the dashboard, book a consultation with us or fill out the form.
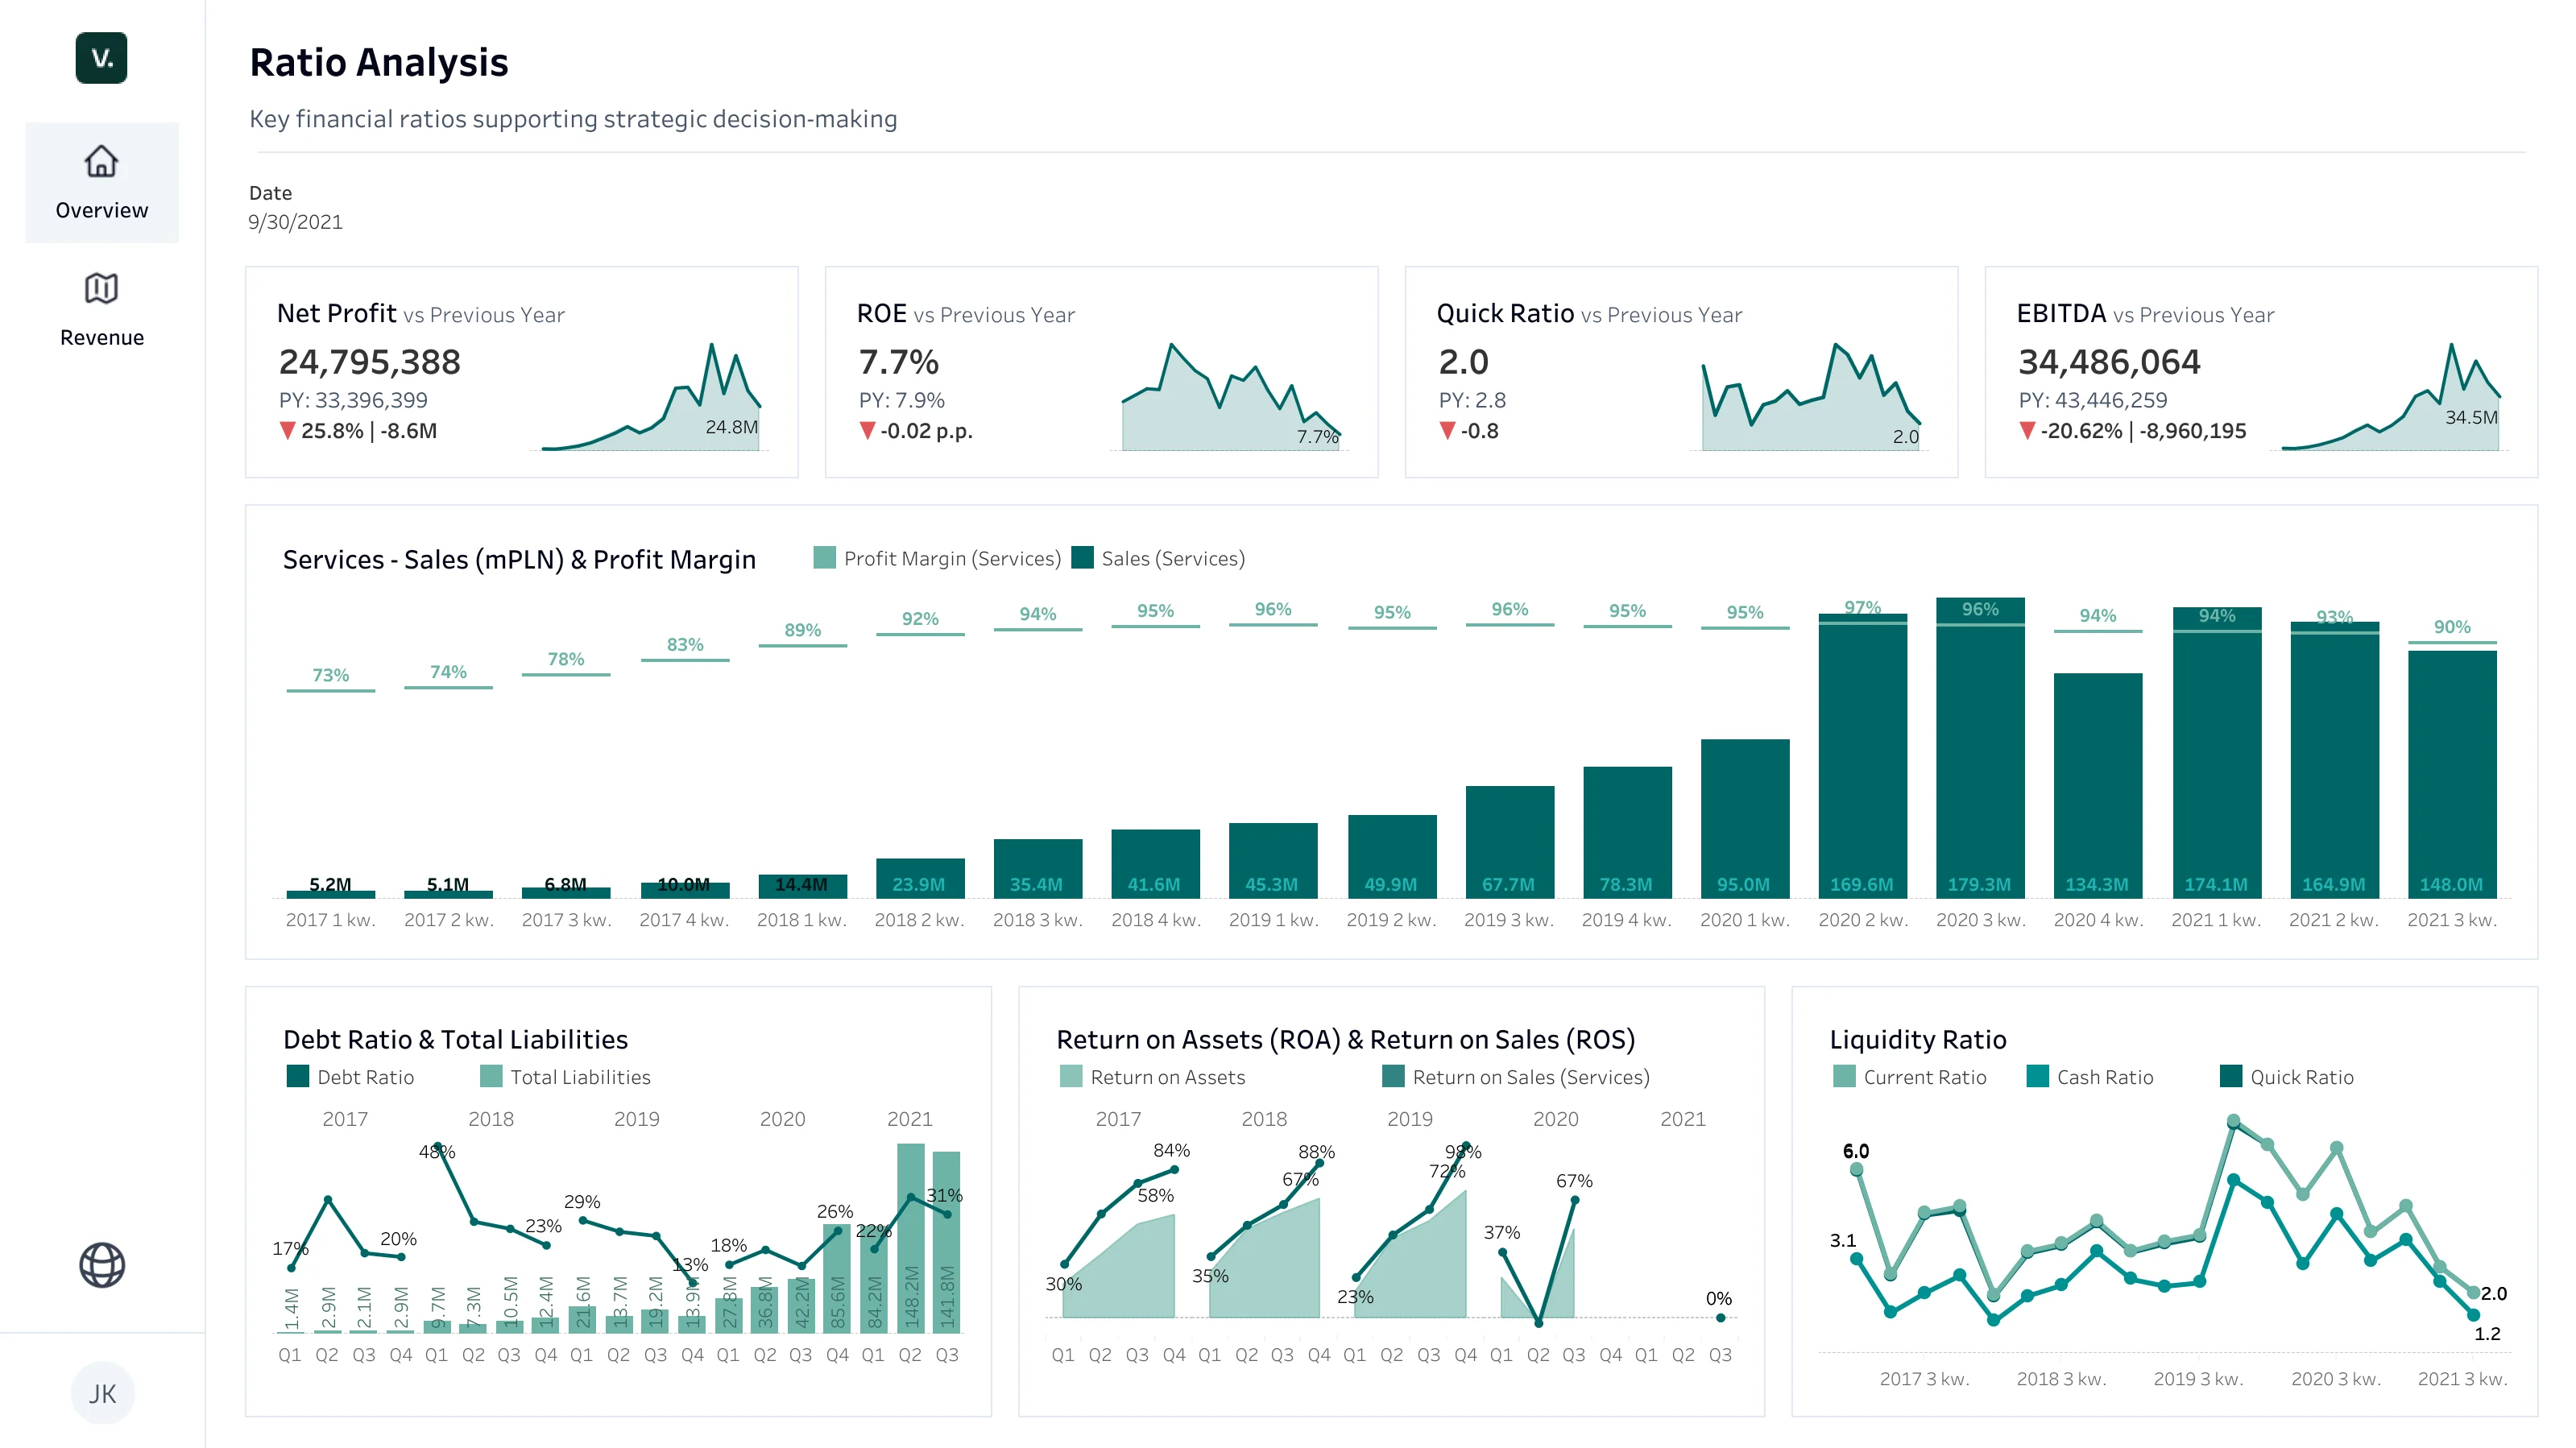
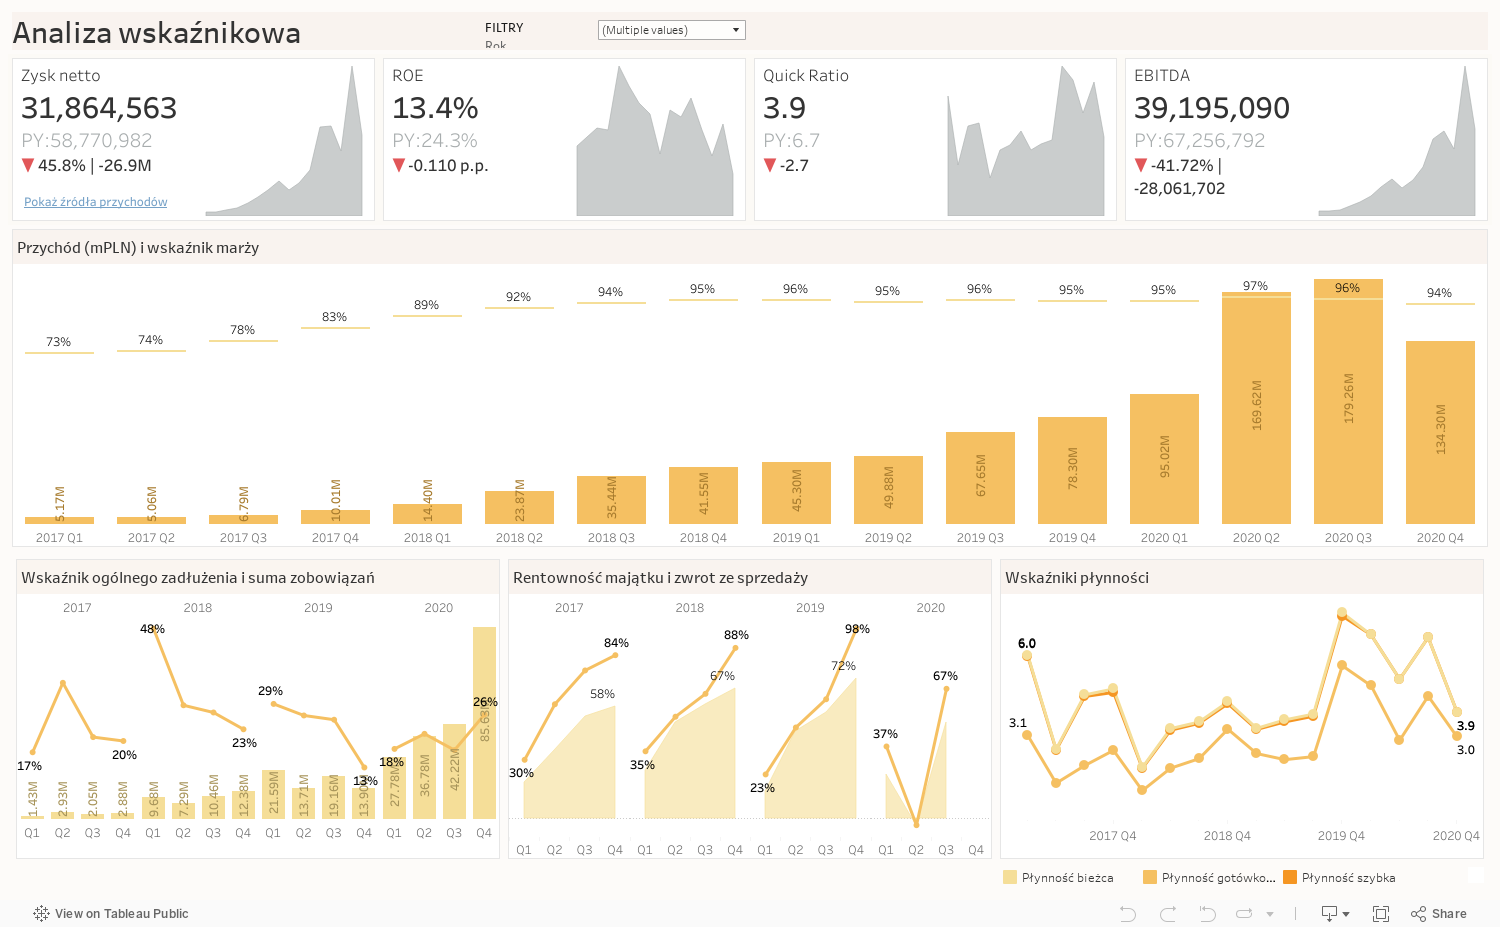
Financial Dashboard - Tableau
An interactive dashboard is an invaluable tool that allows you to quickly and efficiently analyze key financial indicators necessary to make important business decisions. The presentation of financial data in graphical form, with the help of graphs, tables and indicators, allows you to immediately understand complex financial statements and trends.
Free dashboard
Customize your settings and accept functional cookies to see the interactive dashboard in Tableau, or click the link that will take you to Tableau Public.
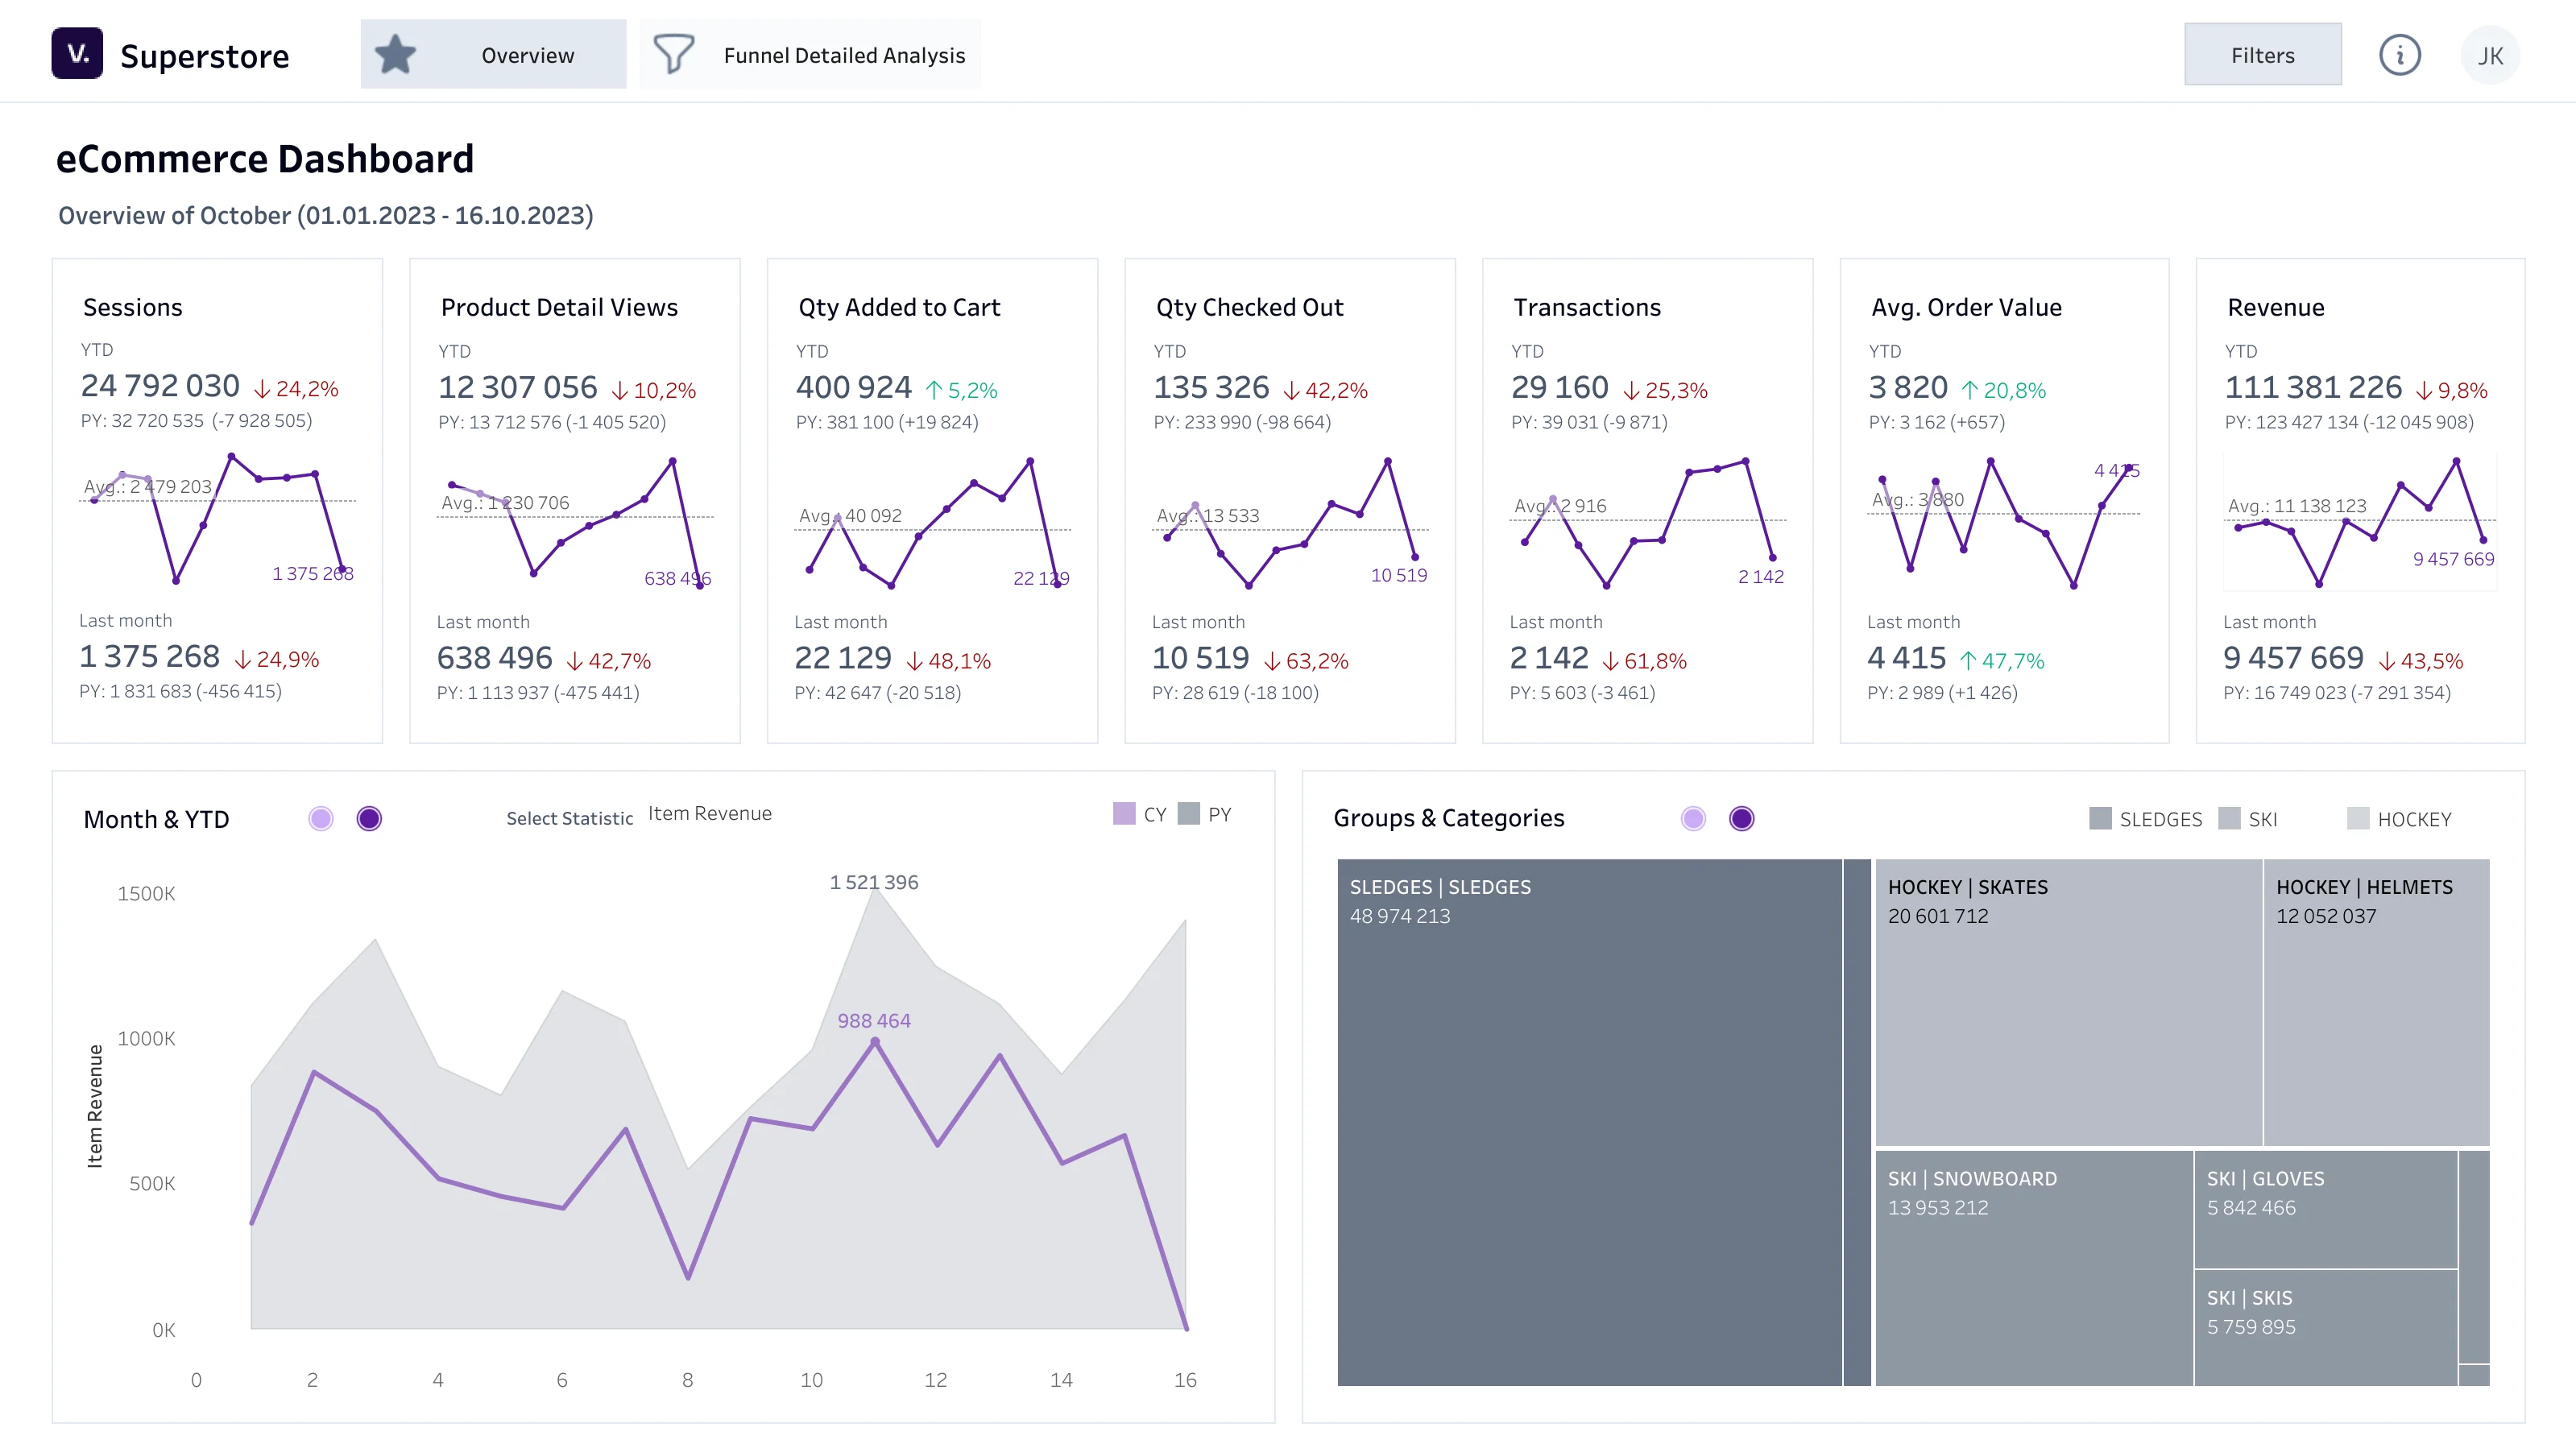
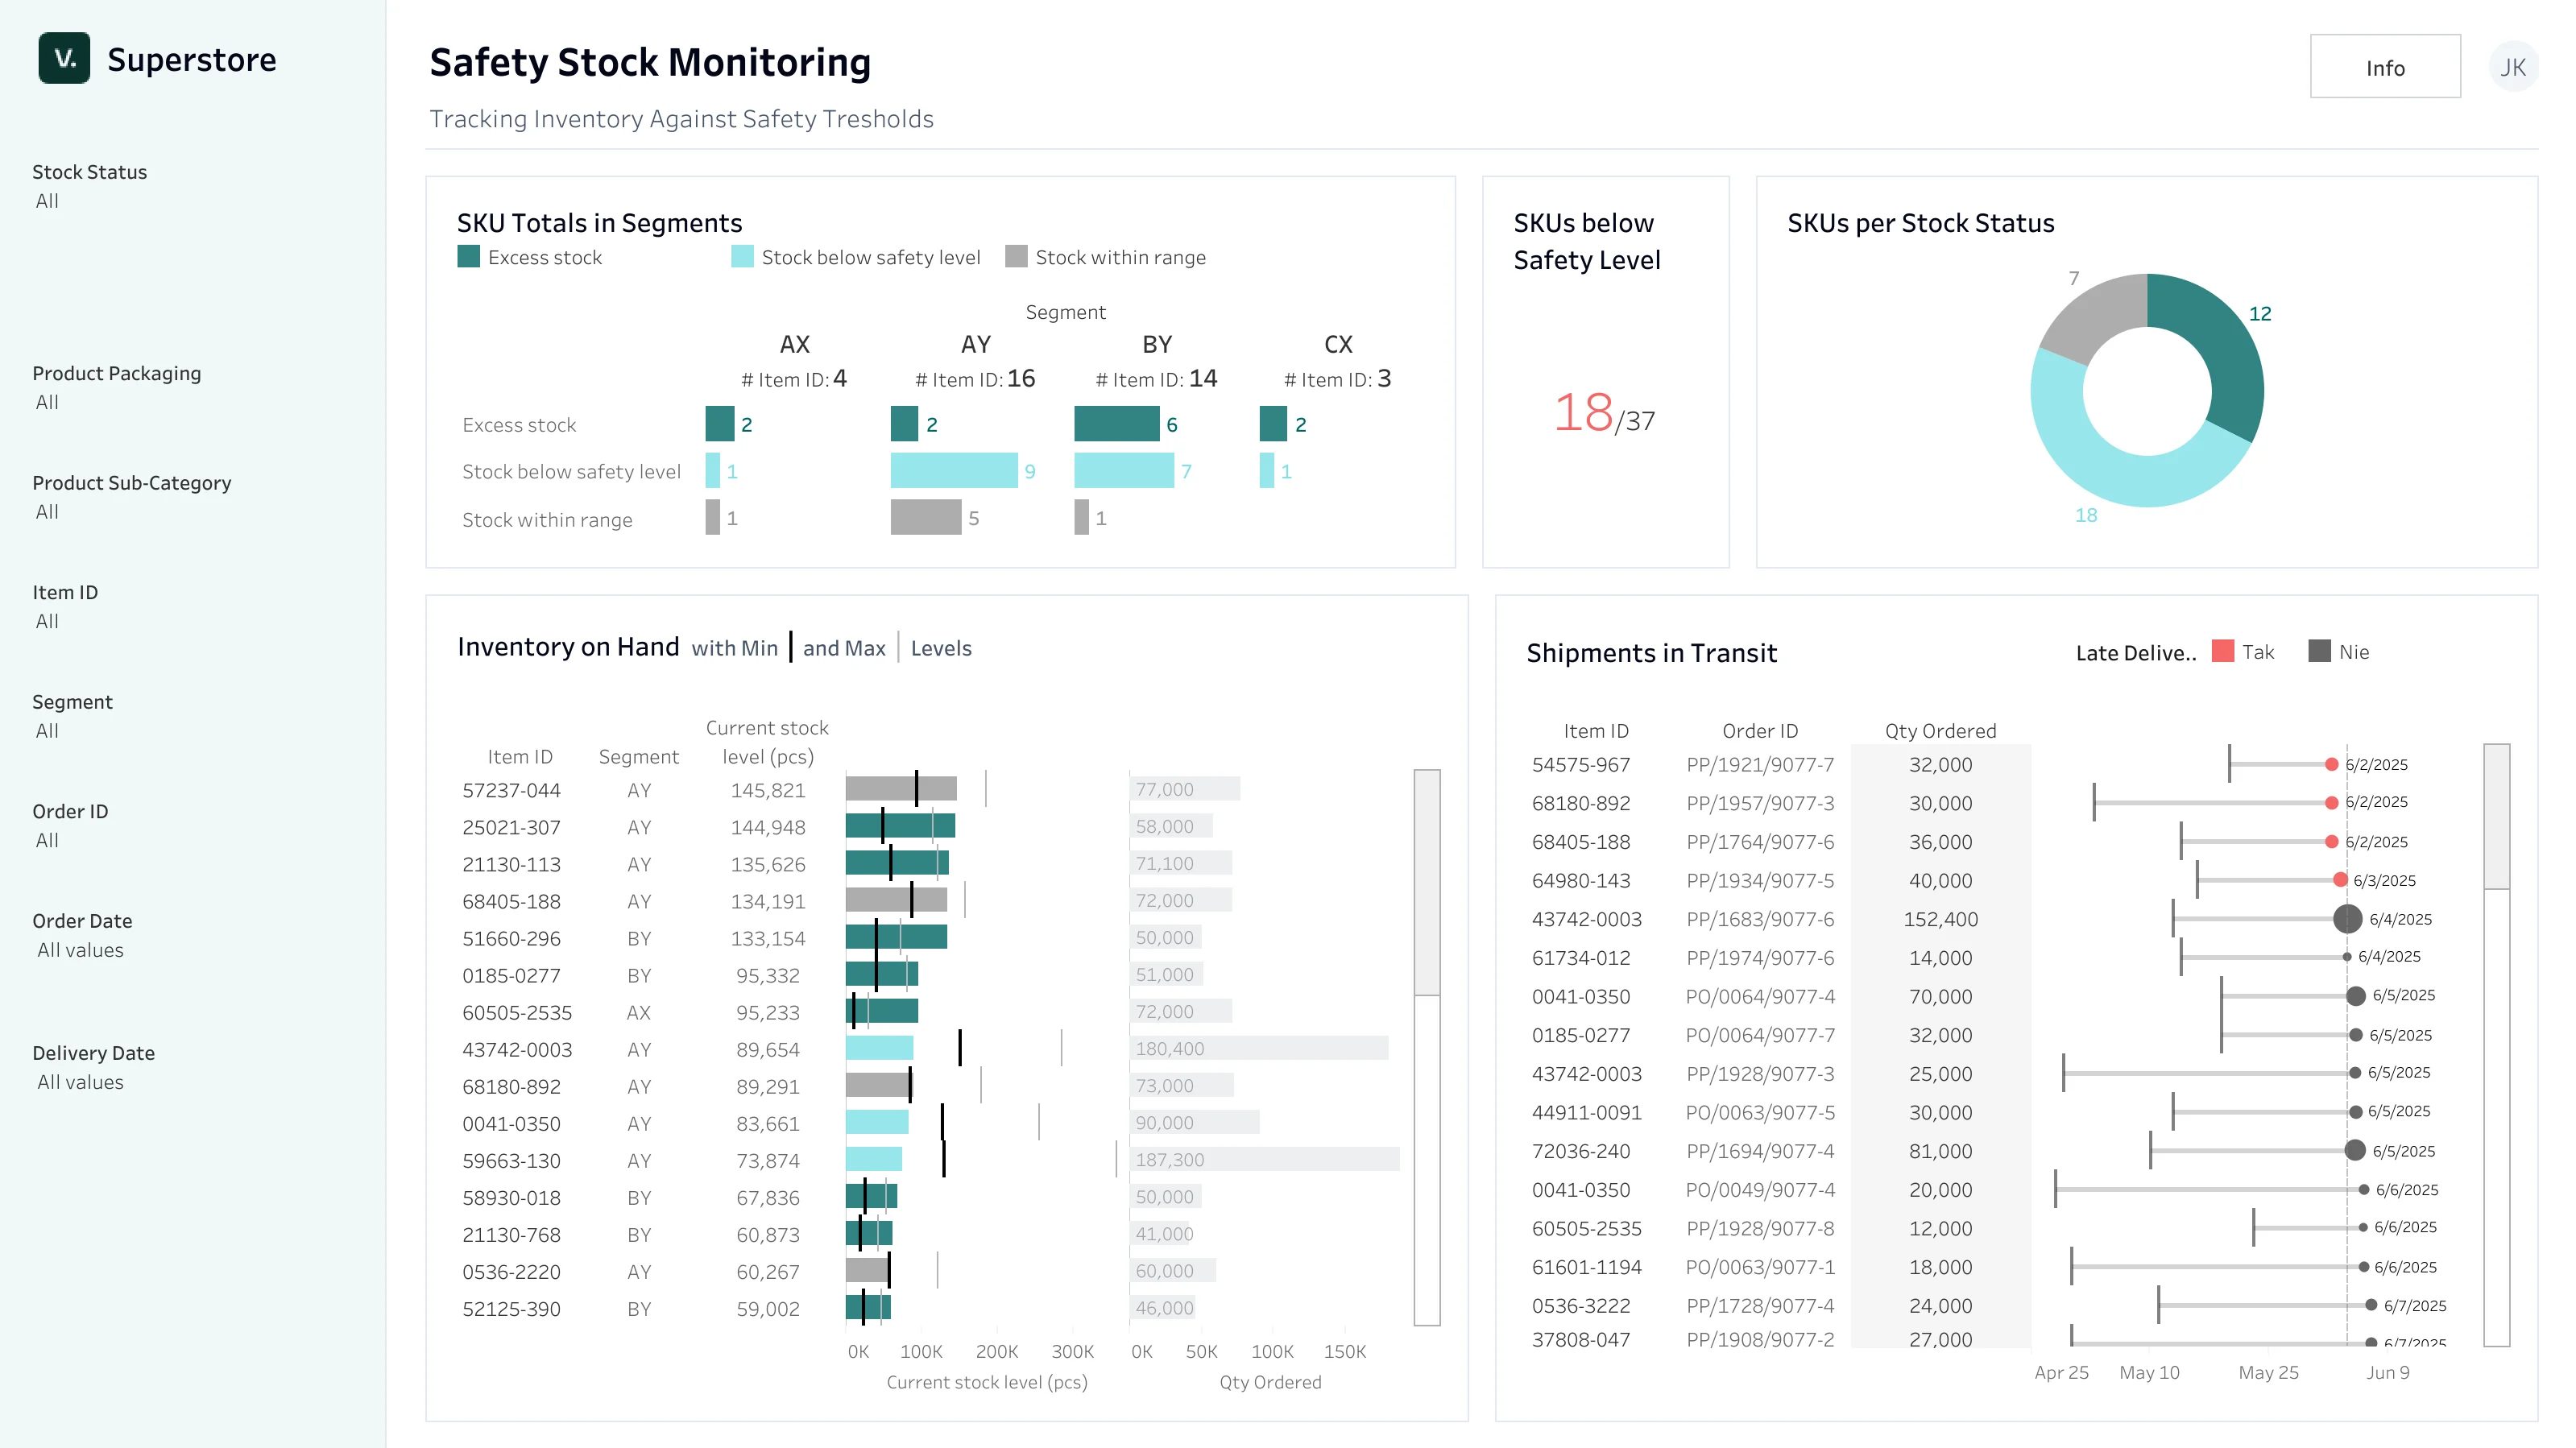
Check out the other dashboards

Get in touch with Business Intelligence experts.
Free consultation
Data is power